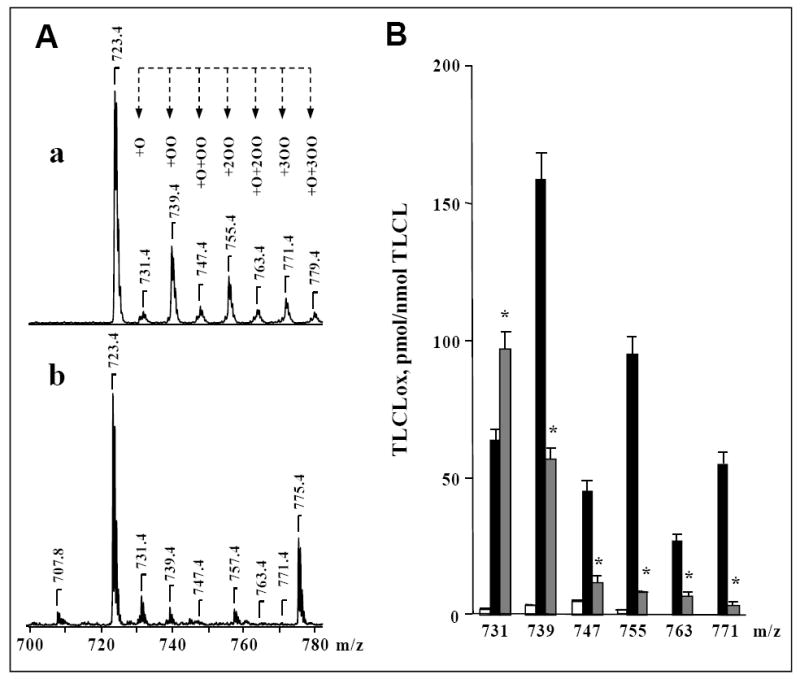
Figure 6. NBD-CL inhibits cyt c-dependent formation of cardiolipin hydroperoxides.

A, a, b – typical mass spectra of TLCL and its H2O2-induced oxidation products formed in the presence of cyt c. Peaks at m/z 723 and 775 correspond to doubly charged TLCL and NBD-CL, respectively. TLCL oxidation products are represented by previously characterized monohydroxy (m/z 731), monohydroperoxy (m/z 739), monohydroxy/monohydroperoxy (m/z 747), dihydroperoxy (m/z 755), monohydroxy/dihydroperoxy (m/z 763), and trihydroperoxy (m/z 771) derivatives of TLCL [33]. Cyt c (5 μM) was incubated with DOPC/TLCL (2:2) liposomes (A, a) or DOPC/TLCL/NBD-CL (2:1:1) liposomes (A, b) (total phospholipids concentration was 500 μM) in the presence of H2O2 (100 μM) for 30 min at 37°C. In the end of incubation, excess of H2O2 was removed by addition of catalase (1.4 U/μL). B – Quantitative analysis of oxygenated molecular species of TLCL. Open bars - control (TLCL/cyt c); filled black bars - after incubation of TLCL/cyt c with H2O2; filled grey bars - after incubation TLCL/cyt c with H2O2 in the presence of NBD-CL. Lipid phosphorus was determined by a micro-method [34]. CL molecular species were quantified by comparing the peak intensities with that of an internal CL standard, which was added to the sample before MS analysis. TMCL was used as an internal standard and TLCL was used as a reference standard [35]. The linear response and detection limit for TLCL were established by injection of calibration mixtures with different concentrations of TLCL and a constant concentration of TMCL. *p<0.05 versus cyt c/H2O2, n=6 independent experiments.
