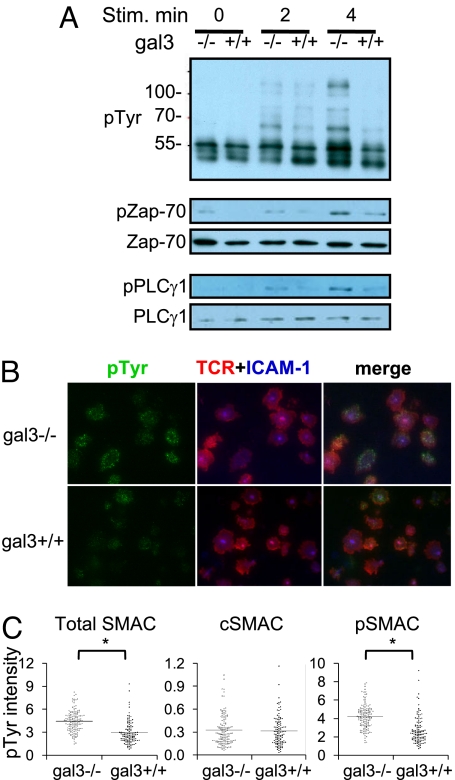
Fig. 4.
Gal3−/− CD4+ T cells exhibit higher TCR-mediated signaling. (A) Purified CD4+ T cells were stimulated with plate-bound anti-CD3/CD28 for the indicated time periods and subjected to immunoblotting analysis. (B) Gal3−/− and gal3+/+ CD4+ T cells were stimulated as mentioned in Fig. 2F. The cells were fixed and stained for phosphotyrosine (pTyr) signals and the images were taken by TIRFM. (C) The relative intensities of phosphotyrosine staining of total SMAC, cSMAC, and pSMAC regions are shown. *Mann Whitney U, P < 0.05.

