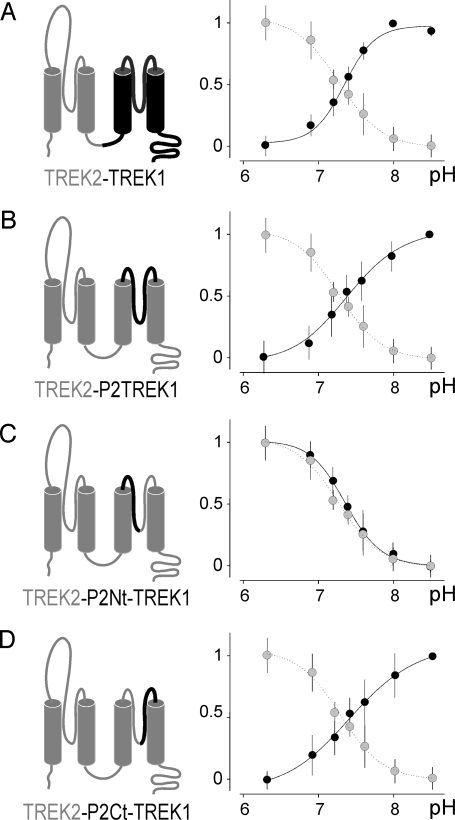
Fig. 5.
Mapping of the region involved in the differential regulation of TREK1 and TREK2. pH dose-response curves of the variable proportion calculated from the normalized current of the current TREK2-TREK1 (A), TREK2-P2TREK1 (B), TREK2-P2Nt-TREK1 (C), and TREK2-P2Ct-TREK1 (D) chimeras, respectively. Dotted curves are the pH dose–response curve of TREK2, shown for comparison.

