Fig. 6.
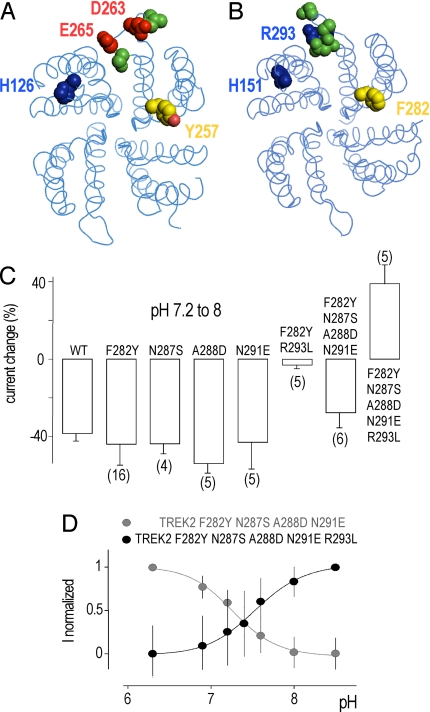
Effect of single and combined mutations on pH-sensitivity to TREK2. Top view of the extracellular side of homodimeric TREK1 (A) and TREK2 (B) channels. Cytoplasmic Nter and Cter domains are not displayed. Studied residues are colored in only one monomer. pH-sensing histidines are indicated. Positively charged residues are in blue and negatively charged residues in red. Neutral residues are depicted in green and aromatics F282 and Y272 are in yellow along with the oxygen atom in red in Y272. (C) The histograms represent the percentage of inhibition or activation at pH 8 relative to pH 7.2 at 0 mV for TREK2 and TREK2 mutants. (D) pH dose-response curves of the variable proportion calculated from the normalized current of TREK2 mutants. Error bars, SEM. The number of cells tested is indicated in parenthesis.

