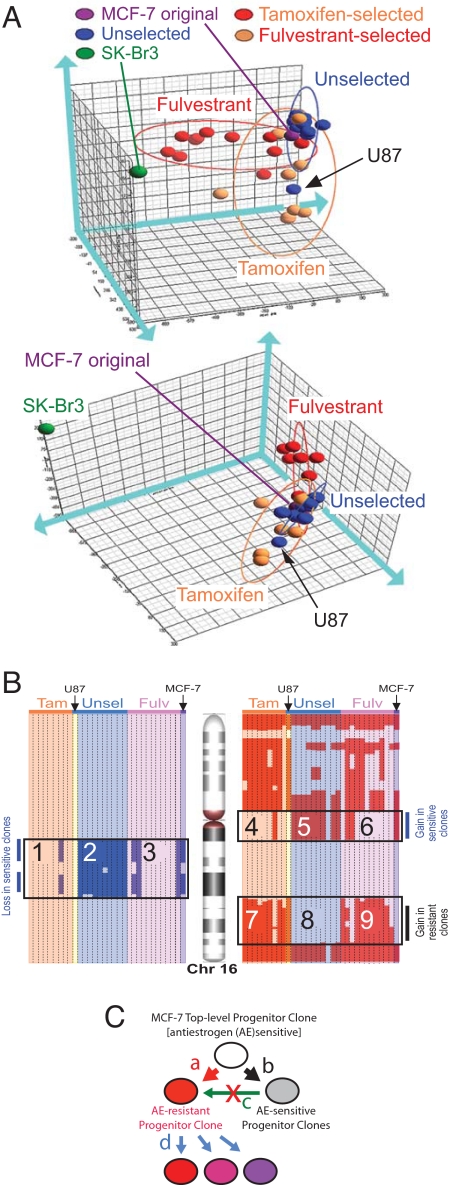
Fig. 4.
gDNA copy number profiling of MCF-7 sublines. (A) Principal component analysis (PCA). Whole-genome copy number profiles of the MCF-7 sublines, the original MCF-7 culture, and SK-Br3 cells are subjected to dimensionality reduction and projected in a 3D space that is shown from 2 different angles of view. Blue, orange, and red ellipsoids represent the PCA spaces for the U-, T-, and F-series sublines, respectively. The arrow indicates the U87 subline, which belongs to the U-series but has its gDNA aberration profile and located within the T-series ellipsoid. (B) Copy number profiling of chromosome 16. Columns represent individual sublines. gDNA segments with increased and decreased copy numbers are indicated by red and blue, respectively. Fulv, fulvestrant selected; Tam, tamoxifen selected; Unsel, unselected series of monoclonal sublines. The original MCF-7 cells and the U-series sublines were sensitive to the cytocidal fulvestrant actions; the T- and F-series sublines and U87 subline (which belongs to the U-series) were resistant. (C) Evolution of the AE-resistant subpopulations in MCF-7 cells. From the top-level progenitor clone, an AE-resistant progenitor clone and an AE-sensitive progenitor clone were generated through accumulation of different sets of gDNA aberrations (arrows a and b, respectively). The AE-sensitive progenitor clone propagated to form the major subpopulation in MCF-7 cells (arrow d); the progenies of the AE-resistant progenitor clone remained as a minor subpopulation. The AE-resistant progenitor clone was not a progeny of the AE-sensitive progenitor clone (arrow c). Progenies of the AE-resistant clone evolved diversified phenotypic features through genetic and nongenetic changes.

