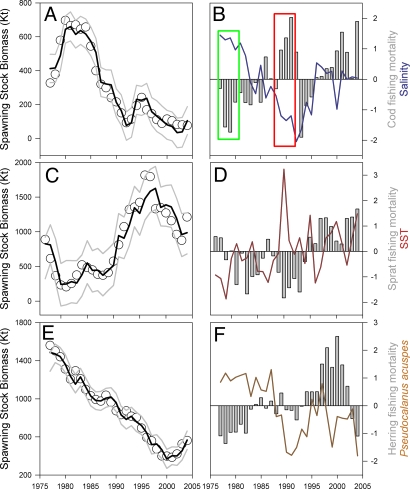
Fig. 2.
Historical development of the Baltic Sea fish populations. (A, C, and E) The fitted biomass values (black lines) represent well the observed biomasses (circles) of cod (r2 = 0.95) (A), sprat (r2 = 0.89) (C), and herring (ir2 = 0.98) (E) from 1977 to 2004. Upper and lower 95% prediction intervals are displayed by gray lines. (B, D, and F) The main external drivers, i.e., fishing mortalities and environmental variables are shown as anomalies (i.e., standardized to zero mean and unit variance) for each species. In B a combination of low fishing mortalities and record high salinities explains the sharp increase in cod during the late 1970s, i.e., the gadoid outburst (green box). On the contrary, decreasing salinities combined with high fishing pressure explain the dramatic decline and collapse of the cod stock in the early 1990s (red box).

