Fig. 3.
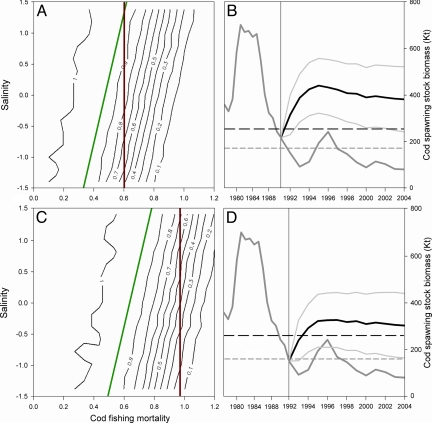
An adaptive management strategy for Baltic cod. (A and C) The probability of cod stock recovery above Bpa (A) and Blim (C) in 1992–2004 is shown over a range of fishing mortalities (F from 0 to 1.2) and salinity levels (i.e., corresponding to the observed standardized salinity range from 1974 to 2004). The red vertical lines show the recommended fixed reference levels, Fpa and Flim, and the green diagonal lines show the adaptive management approach deciding F levels based on salinity conditions. (B and D) The dark gray line represents the observed biomass and the black line represents the simulated biomass following the adaptive management strategy outlined in A and C. The simulations are initialized in 1991 (B) and 1992 (D), the years after the collapse below Bpa and Blim, respectively. Light-gray lines indicate the upper and lower 95% confidence interval of the simulations. Horizontal lines define the ecologically safe levels Bpa (long dash) and Blim (short dash) above which the stock is considered recovered.

