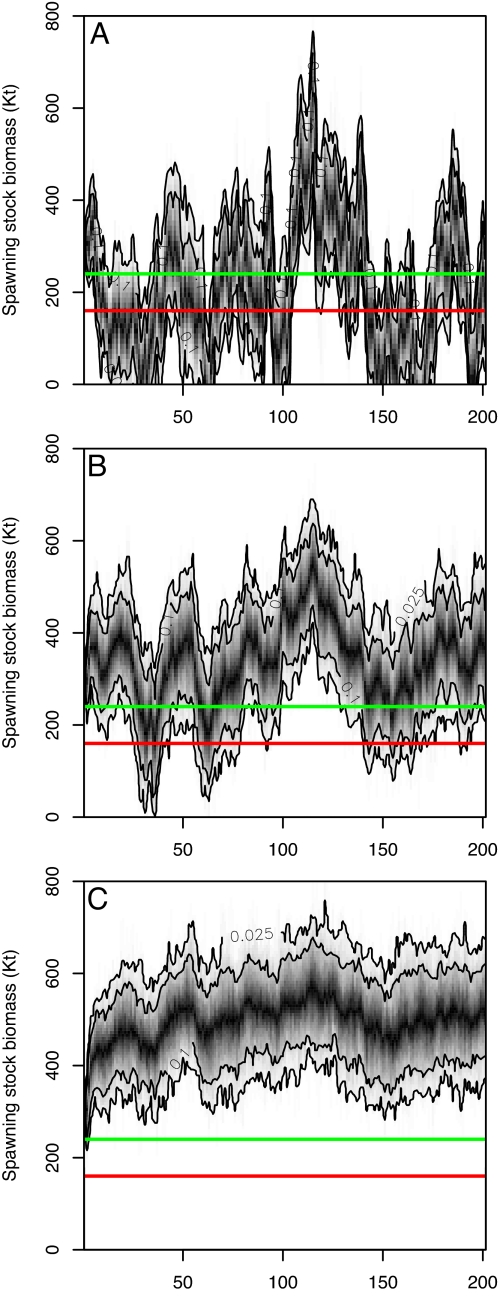
Fig. 4.
Simulated long-term dynamics of Baltic cod under different management scenarios. (A) Fishing mortalities fluctuate at mean historical levels. (B) Fishing mortalities are fixed at Fpa (0.6). (C) Fishing levels are adapted to salinity conditions (i.e., F = 0.6 ± 0.3). To resemble the historical range of fluctuations in SST and salinity, environmental conditions were simulated based on the mean, variance, and autocorrelation structure of the observed time series (1974–2004) using an approach for modeling “red-shifted,” i.e., positively autocorrelated marine environments (39, 40). Simulations were initialized at the mean historical SSB levels for each species and replicated 1,000 times including stochastic process noise. Solid horizontal lines mark the recommended ecologically safe levels of Baltic cod, the precautionary stock level, Bpa (green), and limiting stock level, Blim (red). Black contour lines show the 90% and 95% prediction intervals within which the cod stock dynamics of each replicated run fluctuates.

