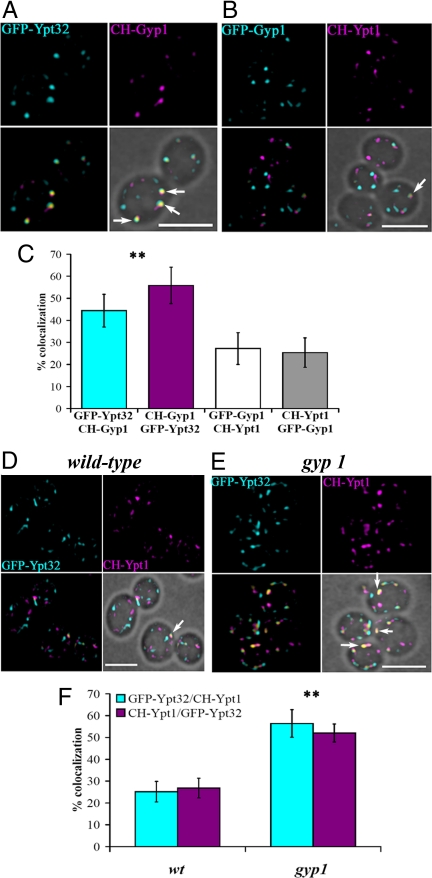
Fig. 3.
Co-localization of Gyp1p with Ypt32p and the role of Gyp1p in limiting co-localization of Ypt1p and Ypt32p. (A) Fluorescent images of gyp1 cells expressing GFP-Ytp32p and CH-Gyp1p (NY2778). Merged fluorescent images were superimposed with the bright-field image (Lower Right) to show the cell contour. Arrows indicate spots where GFP-Ypt32p and CH-Gyp1p co-localized (yellow spots). (B) Fluorescent images from gyp1 cells expressing GFP-Gyp1p and CH-Ypt1p (NY2779). Arrow indicates a spot with co-localized GFP-Gyp1p and CH-Ypt1p. (C) Bar graph shows the percentage of co-localization of the following proteins: GFP-Ypt32p spots containing CH-Gyp1p signal (cyan bar), CH-Gyp1p spots containing GFP-Ypt32p signal (magenta bar), GFP-Gyp1p spots containing CH-Ypt1p (white bar), and CH-Ypt1p spots containing GFP-Gyp1p (gray bar; ≈100 cells, 2–5 spots/cell, error bar indicates SD); **P < 0.001 (t test) between Gyp1p/Ypt32p and Gyp1p/Ypt1p. (D) Fluorescent images of WT cells expressing GFP-Ypt32p and CH-Ypt1p (NY2780). Arrow indicates a spot with both GFP-Ypt32p and CH-Ypt1p. (E) Fluorescent images of gyp1 cells expressing GFP-Ytp32p and CH-Ypt1p (NY2781). Arrows indicate spots in which GFP-Ypt32p and CH-Gyp1p co-localize. (F) Bar graph shows the percentage of compartments in which GFP-Ypt32p and CH-Ypt1p (cyan bars) co-localize, or compartments in which CH-Ypt1p and GFP-Ypt32p (magenta bars) co-localize in WT and gyp1 cells (≈100 cells, 2–5 spots/cell, error bar indicates SD); **P < 0.001 (t test) between WT and gyp1. (Scale bar, 5 μm.) Image acquisition data are provided in SI Methods.

