
Fig. 8.
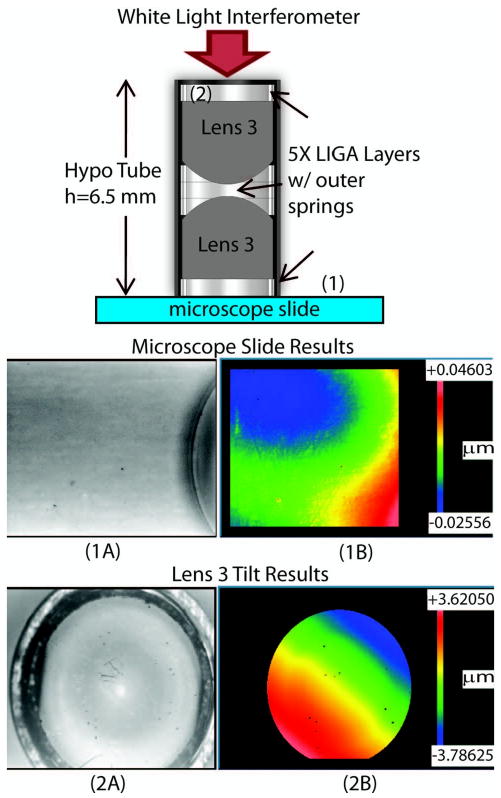
Element tilt test setup and results. (1A) Gray scale image and (1B) WLI tomography results taken from region 1 (microscope slide). (2A) Gray scale image and (2B) WLI tomography results taken from region 2 (top of Lens 3) used to find tilt system components.