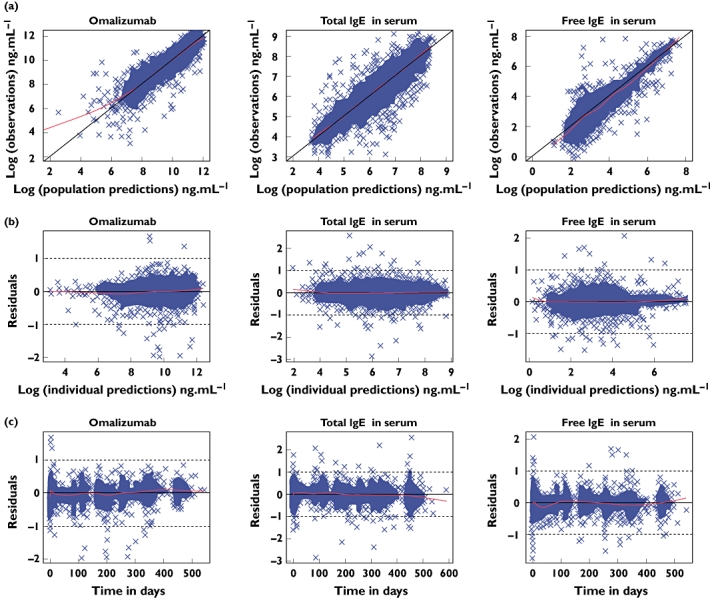
Figure 1.

Diagnostic plots for assessment of model fit to the data: (a) observations vs. population prediction, (b) residuals vs. concentration and (c) residuals vs. time. The line through the centre is a local regression with a span of 0.25 generated using the LOESS function in R. Given that an additive error model was used on log-transformed data, the units for the residuals are loge of the concentrations in ng ml−1; 0.5 loge unit is 1.6 fold, or, on the linear scale, +65%, −39%
