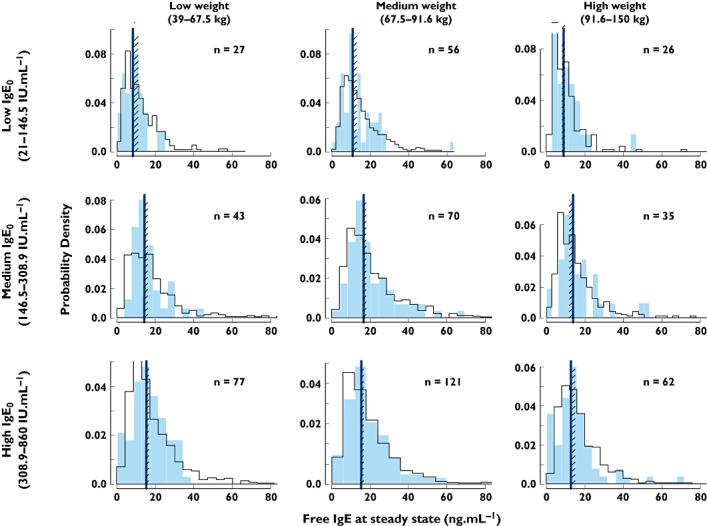
Figure 3.

Predictive check of the omalizumab–IgE model on to the distribution of free IgE at steady state for different regions of the dosing table, using the combined data from Phase III studies [13, 23–25]. The solid histograms are the observed data from the Phase III studies for the numbers of patients indicated. The open histograms are from a model simulation of a total of 19 330 patients, split into the nine subsets. The lines are the medians of the observed data, the cross-hatched areas the 95% confidence interval for the median from the simulations. observed ( ); predicted (
 )
)
