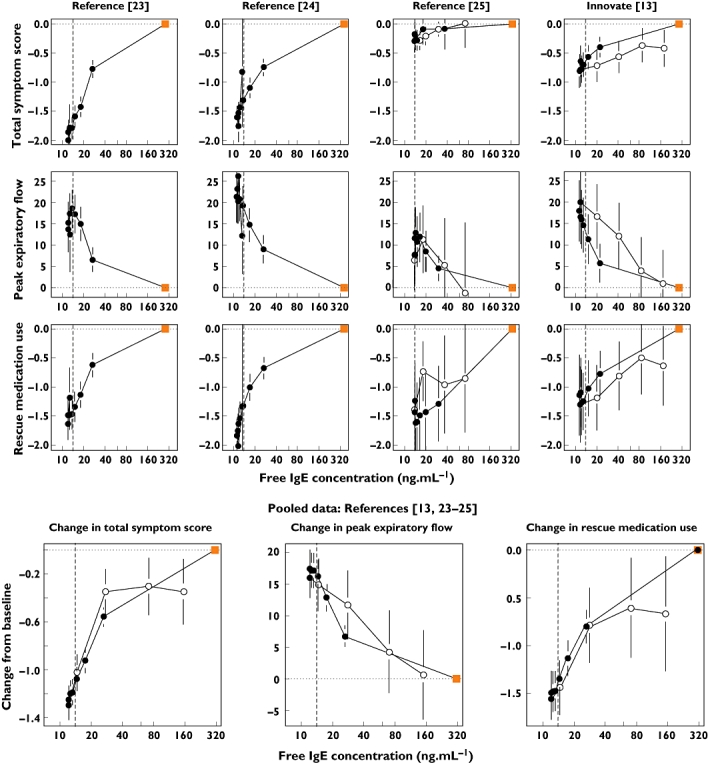
Figure 5.

Correlation between the change from the baseline (time zero) value of the total symptom score, morning peak expiratory flow and rescue medication use with free IgE across four Phase III studies [13, 23–25]. The symptoms are the mean values for 28-day observation periods; the free IgE value is that predicted for the midpoint of each 28-day period. The square symbol represents the baseline IgE value and zero point for changes in symptoms, with the closed circles being the values whilst on treatment, the open circles during follow-up after treatment cessation. The lower figures show the correlations for the integrated dataset of four studies. All plots show a vertical indicator line at 14 ng ml−1. The error bars are the standard errors for the means. The units for peak expiratory flow are l min−1, those for rescue medication use are puffs per day
