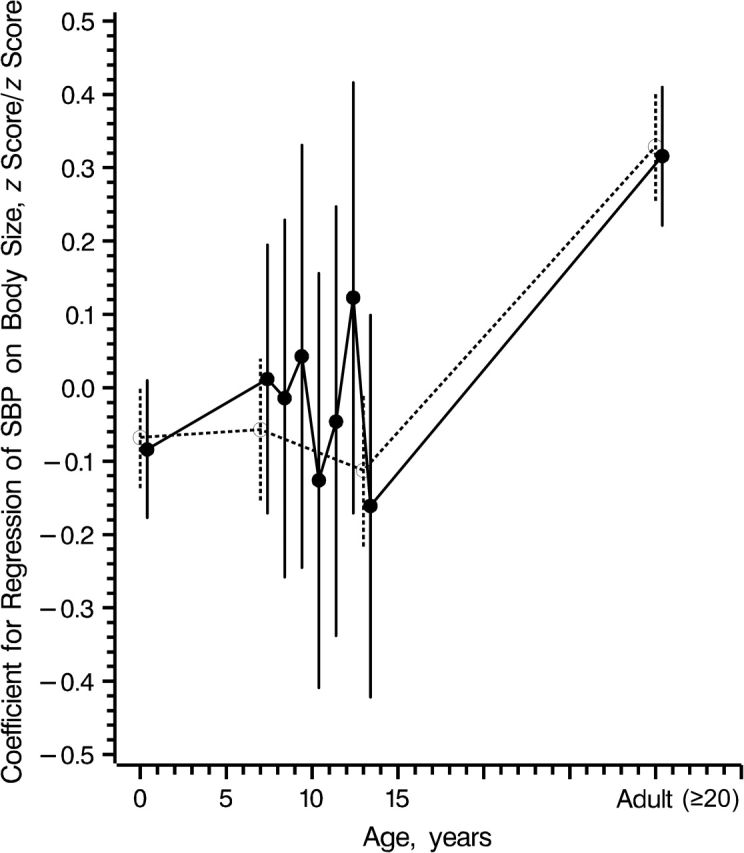
Figure 2.

Life course plot (solid line), as suggested by Cole (18). The plot shows multiple regression coefficients (circular points) from the regression of systolic blood pressure (SBP) z scores on birth weight and body mass index z scores, by age at body size measurement. The dashed line represents a modified version of the life course plot using a reduced multiple regression of SBP on body size. Vertical lines, 95% confidence interval.
