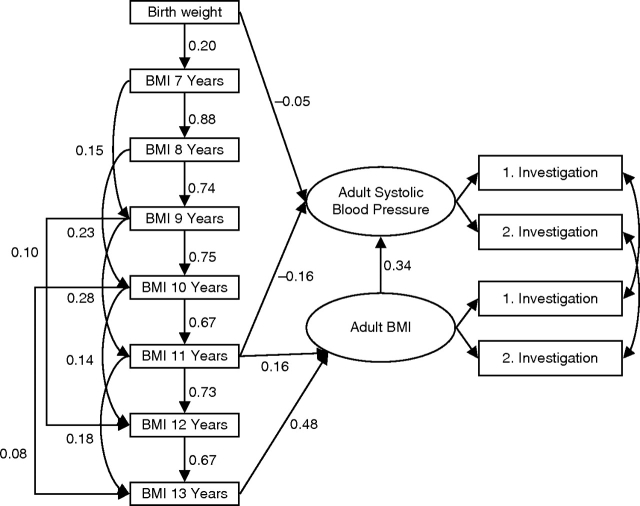
Figure 4.
Path diagram illustrating the final model for the regression of adult systolic blood pressure z score on body size z score. The numbers in the diagram are regression coefficients. For example, the coefficient for the regression of body mass index (BMI) z score at age 7 years on birth weight z score is 0.20. (See Figure 1 for interpretation of a path diagram.)

