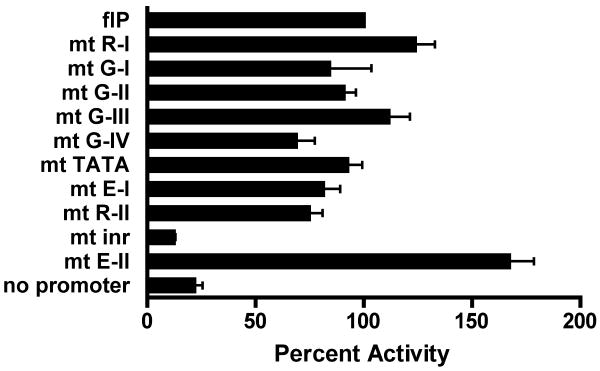
Figure 7.
Promoter activity of pGL3-Eβ containing the indicated PCR fragments is expressed as percent of PCR-generated full-length promoter control (flP′). Bars represent mean normalized luciferase activity ± SEM of 4 independent transfections. Targeted binding site mutations are indicated as white boxes.

