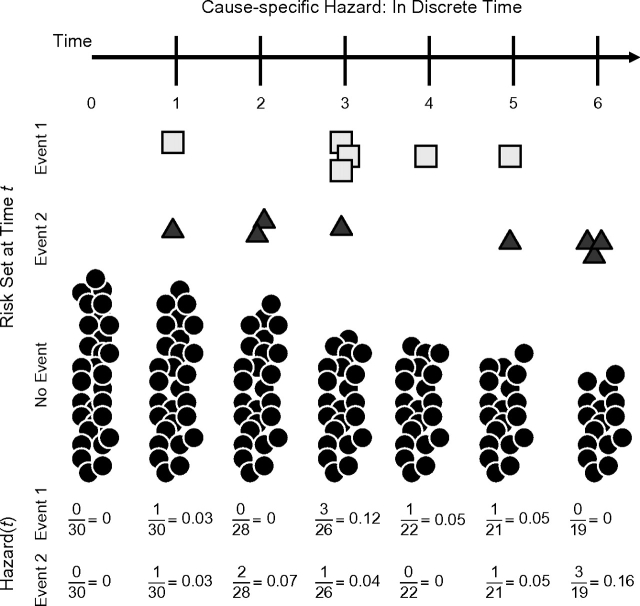
Figure 1.
Cause-specific hazard schematic. The risk set starts with 30 individuals (solid circles). Over time, individuals have either event 1 (square) or event 2 (triangle). As individuals have either event, they are removed from the remaining risk sets. The calculation for the cause-specific hazard is given at the bottom of the figure.

