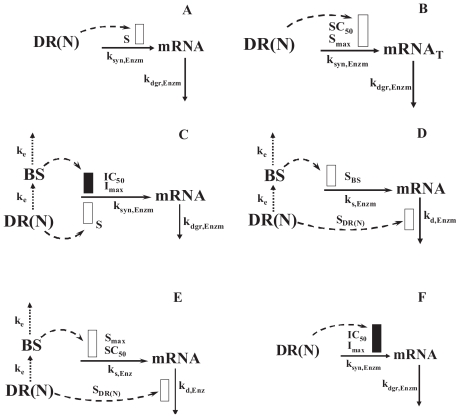
Figure 3. Pharmacogenomic models for CS effects on genes related to urea cycle via various mechanisms.
Models A to F are defined in detail in the Methods section and with Eq. 9–16. The rectangles indicate stimulation (open bar) and inhibition (solid bar) of the various processes via indirect mechanisms.

