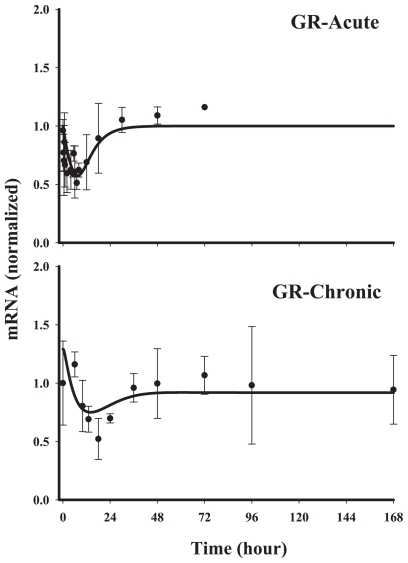
Figure 9. Fitting results of gene array data for glucocorticoid receptor.
Solid circles are the mean data with standard deviations. Solid lines are fittings with Model F (Eq. (16)) after MPL administration. The estimated parameters are listed in Table 5.

