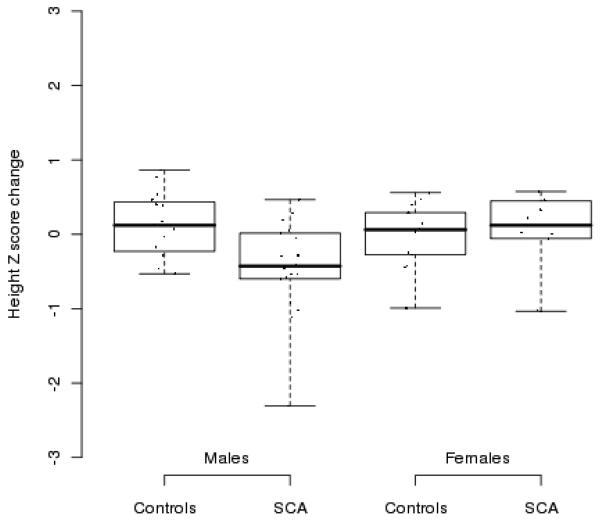
Figure 1.
Change from baseline in height Z score for boys and girls with SCA controls after 2 consecutive follow-up years. The figures illustrate individual Z score change (points), median (middle thick line), and a range between 1 and 3 quartiles (box). Lower and upper bars illustrate 1.5 interquartile range distance.

