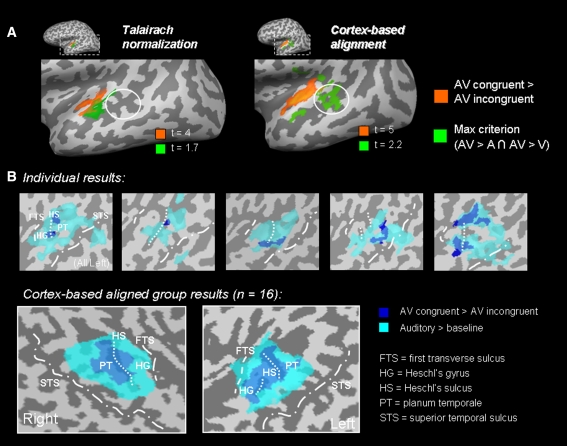
Fig. 2.
fMRI group analysis results using volumetric normalization (Talairach space) and cortex-based alignment. a Random-effects statistical maps of two different contrasts: audiovisual congruent versus audiovisual incongruent (orange) and the max criterion expressed as the conjunction (intersection) of audiovisual versus auditory & audiovisual versus visual (green). The maps show that at higher t values, the cortex-based aligned data still provide a better group map (i.e., location of the clusters correspond best to the activations in individual subjects). b Individual (top row) and group (bottom row) statistical maps of the contrasts audiovisual congruent versus audiovisual incongruent (dark blue) and auditory versus baseline (light blue). Top row shows the reconstructed and flattened cortical sheets of the left temporal lobe in five representative individual subjects, the bottom row shows the cortex-based aligned group statistics (of 16 subjects) on a representative left and right temporal lobe. White lines indicate the different sulci and borders between the gyri, from anterior to posterior: FTS first transverse sulcus, HG Heschl’s gyrus, HS Heschl’s sulcus, PT planum temporale, STS superior temporal sulcus

