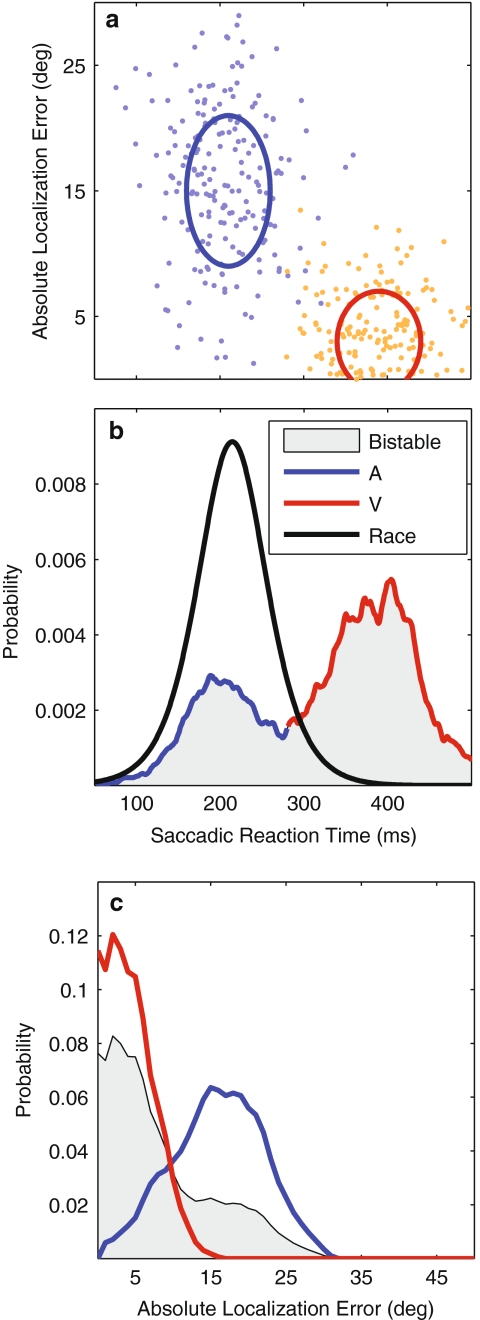
Fig. 2.
Predictions of models. a Hypothetical distributions of SRT-localization errors for unisensory responses (blue: A-only, orange: V-only). Blue and red ellipses denote 1 SD around the mean. A—responses are fast but inaccurate; V—saccades are accurate but slow. b Distribution of SRTs according to two conceptual models: gray shading: bistable model (with α = 1/3, Eq. 7), black curve: race model (Eq. 6). The blue–red curve indicates a higher probability of eliciting an auditory response in blue and a visual response in red. c Distribution of AV saccade errors according to the bistable model (gray shading). Blue and red curves indicate the unisensory error distributions (auditory and visual, respectively). Note that the race model would predict an error distribution close to the auditory response distributions

