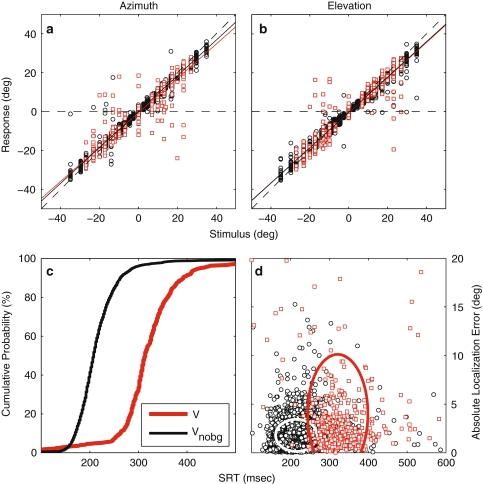
Fig. 3.
Effect of AV-background on V-saccades. Red/black symbols: V/VNOBG.a, b Stimulus–response plots of endpoints of primary V-saccades against stimulus a azimuth and b elevation. c Cumulative SRT probability functions. d Absolute localization error as a function of SRT. Ellipses circumscribe 2 SD around the mean. Data pooled across subjects

