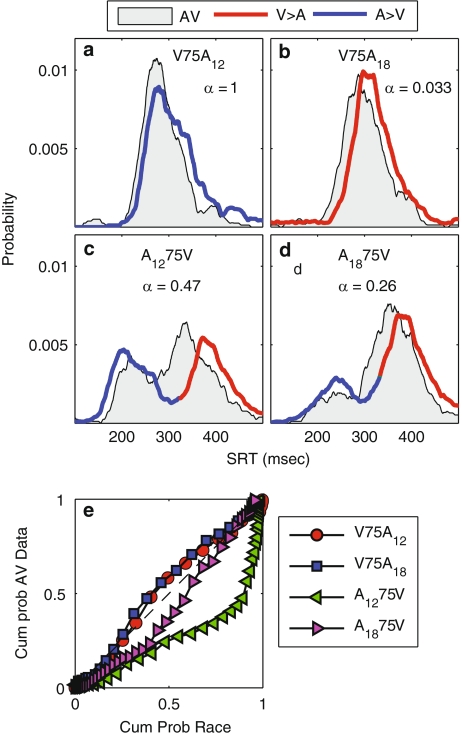
Fig. 5.
Comparison of SRT distributions for AV-aligned trials. a–d The bisensory SRT distributions (gray patch) for a V75A12, b V75A18, c A1275V, and d A1875V, are shown as probability distributions. a–d Predicted bistable distributions (Eq. 7) are shown as red–blue curves, with blue indicating a larger probability of responding to A at a given SRT, and red indicating a larger probability for V. Parameter α is probability of responding to an auditory stimulus in a given trial (irrespective of SRT, Eq. 7). e Comparison of bisensory SRTs to the predictions of the stochastic-independent race model (Eq. 6)

