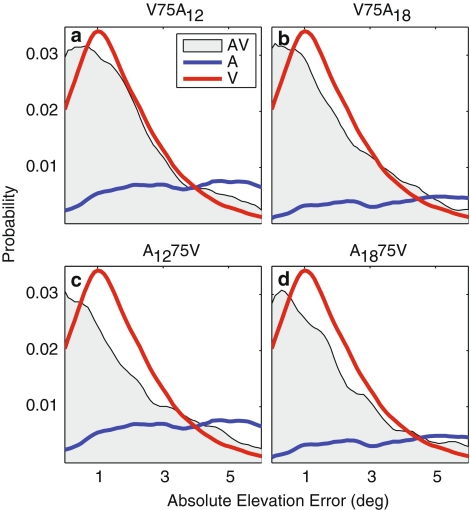
Fig. 6.
Comparison of localization error distributions in elevation. a–d The bisensory (gray patch) and unisensory (V, red; A, blue) error distributions for a V75A12, b V75A18, c A1275V, and d A1875V. Note that, for each condition, the AV distribution is shifted toward smaller errors than the best unisensory (visual) distribution

