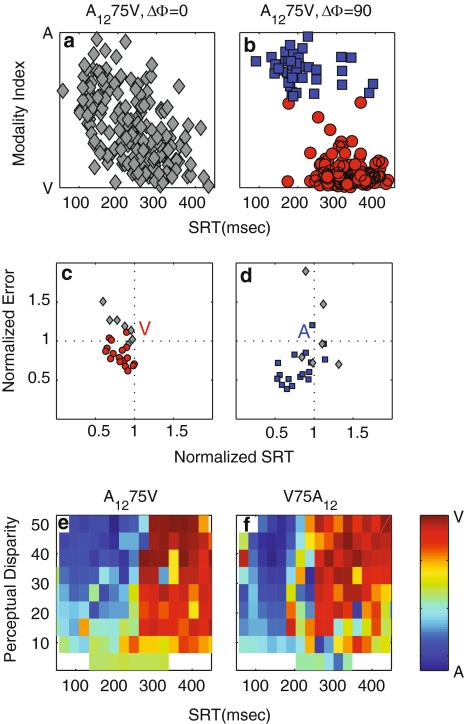
Fig. 8.
Performance for spatially disparate conditions. a Modality index as a function of SRT for spatially aligned A1275V stimuli. MI gradually runs from values near +1 (A-response) to −1 (V-response) in this single-clustered dataset. b Disparate condition (∆Φ = ±90°). K-means cluster analysis yielded two distinct clusters: blue squares, cluster 1 data; red circles, cluster 2 data. Cluster 1 represent aurally driven saccades, cluster 2 are visually triggered responses. c Error versus SRT for all 24 AV conditions of the cluster 2 data, normalized by mean V-saccade error and SRT (red circles) d Error versus SRT for all 24 AV conditions of the cluster 1 data, normalized by mean A-saccade error and SRT (blue squares). Gray squares in (c, d) represent conditions that yielded single-clustered data (because of low silhouette-values [<0.6] or a small number of responses in one of the two K-means clusters [<5]). e MI as a function of the perceived disparity (in deg) and SRT for A1275V stimuli. f Same for V75A12 stimuli

