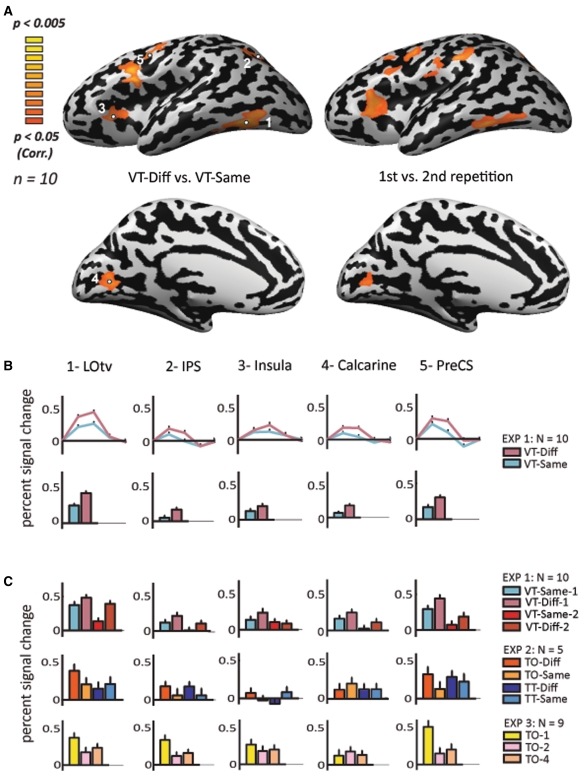
Fig. 2.
Statistical parametric maps and magnitude of response in the left hemisphere. a Activation maps of the left hemisphere for VT-diff versus VT-same (left) and for first exposure versus the second exposure of all VT objects conditions (right). Statistical parametric maps of activation (n = 10) using a random-effect GLM analysis. The data are presented on MNI full Talairach inflated brain. Color scale denotes significance (corrected for multiple comparisons). b Time course analysis of activation and average percent signal change in the five regions of interest defined by the five significant VT-diff versus VT-same clusters presented in A. c Average percent signal change in the same ROIs for first exposure versus second exposure of all VT objects conditions (n = 10), and in the two control experiments below (experiment 2, n = 5; experiment 3, n = 9)

