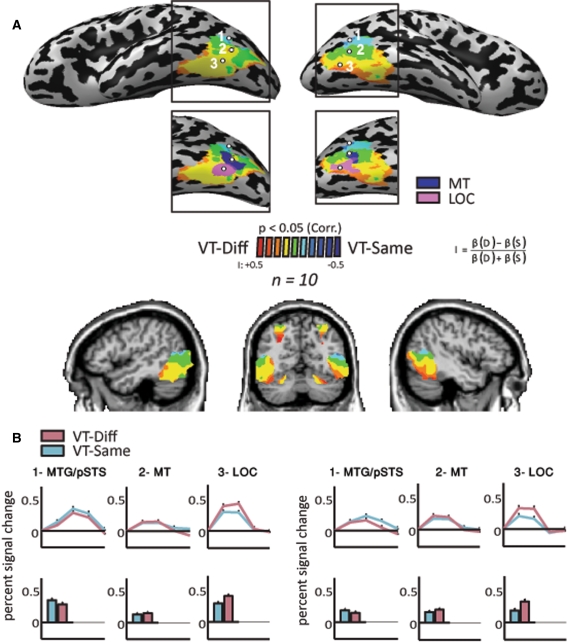
Fig. 4.
Indications for a topographical gradient in VT-adaptation in the lateral–ventral occipital–temporal cortex. a Results of cross subject (n = 10) GLM Two-color contribution analysis (see methods) are presented on MNI Talairach normalized inflated brain in a lateral-ventral view. Color scale denotes the relative preference of each voxel for one of the two conditions (VT-diff and VT-same). Voxels showing preference for VT-diff appear in red (I > 0), and those with VT-same preference (I < 0) are in blue. The inset present the same map aligned with MT (blue) and LO (pink) Localizers. b We defined three ROIs along the dorsal–ventral axis of the occipital–temporal cortex: The most dorsal ROI is the MTG/pSTS (anatomical localizer), the most ventral ROI is LOC (using objects vs. scrambled images localizer) and intermediate MT ROI (using the MT localizer; see “Methods” for more details on localizers and ROI selection). The average time course (across subjects) and percent signal change histograms for these three ROIs are presented

