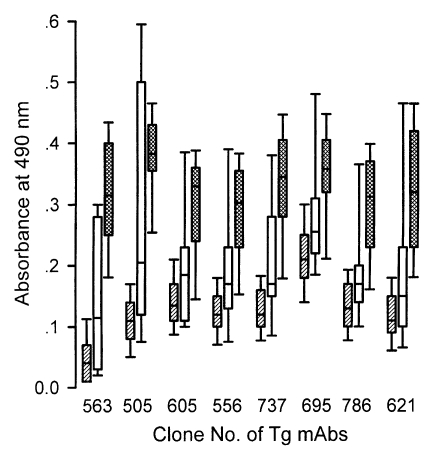
Fig. 7.
Distributional pattern of sandwich-ELISA with various subcellular organelle specific monoclonal antibodies to cat sera. Monoclonal clones were derived from Fig. 5. Hatched boxes indicate the negative sera, blank boxes, false reactive sera of Fig. 4, and cross hatched boxes, positive sera, respectively.

