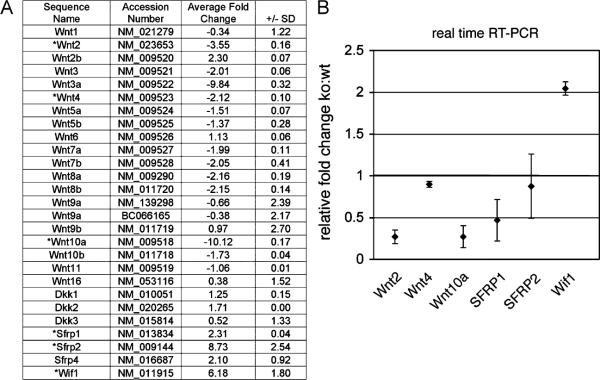
Fig. 3.
Microarray analysis indicated that the loss of prostatic inductivity by Tgfbr2fspKO UGM was associated with the down-regulation of many Wnt ligands and the up-regulation of Wnt antagonists. (A) The list illustrates the accession number, gene name, and fold change (± standard deviation) comparing three Tgfbr2fspKO UGM to three pooled Tgfbr2floxE2/floxE2 UGMs. The genes suggested to have greater than two-fold change and significant p-value by microarray analysis were validated by real-time RT-PCR (asterisk). (B) The graph indicates mean±standard deviation of real-time RT-PCR data (p<0.01, n = 3).

