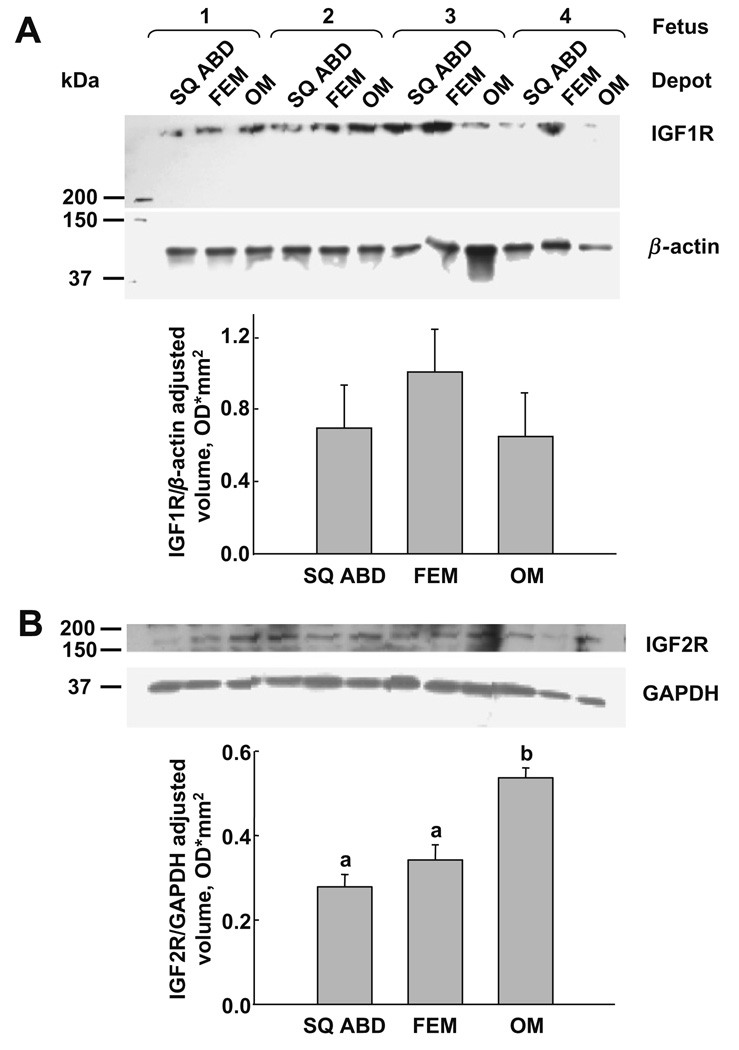
Fig. 2.
Immunoblots for IGF receptors in adipose-derived SV cultures by fat depots (n = 4). (A) IGF1R protein expression was similar among depots. Mean ± SEM; SQ ABD, 0.69 ± 0.24; FEM, 1.00 ± 0.24; OM, 0.65 ± 0.24 U/mm2 (B) IGF2R protein expression was higher in OM compared to both SQ ABD and FEM fat depots. Mean ± SEM: SQ ABD, 0.28 ± 0.03a; FEM, 0.34 ± 0.04ab; OM, 0.53 ± 0.02b U/mm2. Different letters in the superscripts indicate a difference among depots, p < 0.05.

