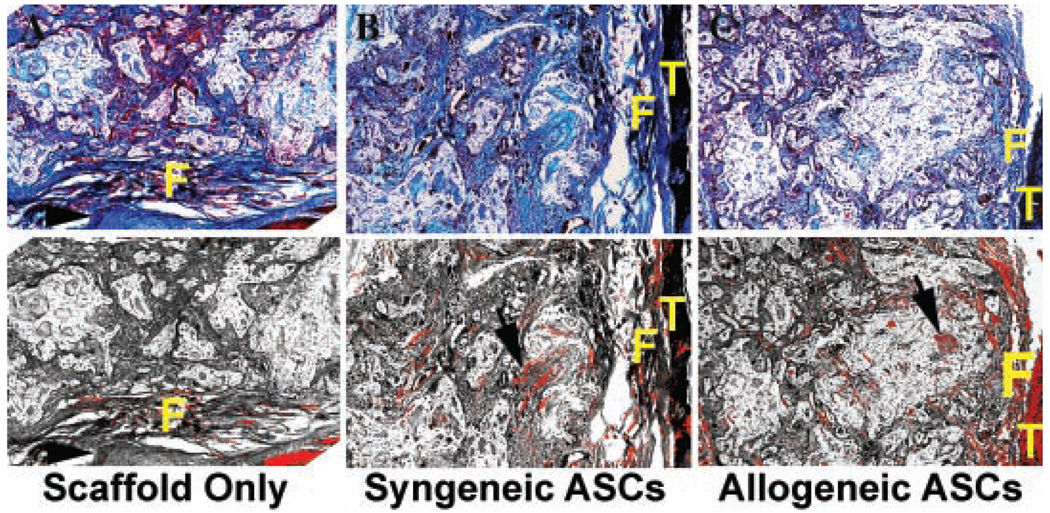
Figure 4.
Photomicrographs of representative fusion masses (5×) from ASC treatment cohorts 8 weeks after implantation. Bright-field images (upper) followed by polarized light images of sections stained with Masson’s trichrome were captured. Paired images were superimposed for quantification of refractile tissue (black arrows) with graphics software (lower). Light diffraction due to tissue mineralization is pseudocolored red in composite images. Fibrous tissue (F) is visible in each image and transverse processes (T) are visible in two of the images. A vertebral body is apparent in the scaffold only image (arrow head).

