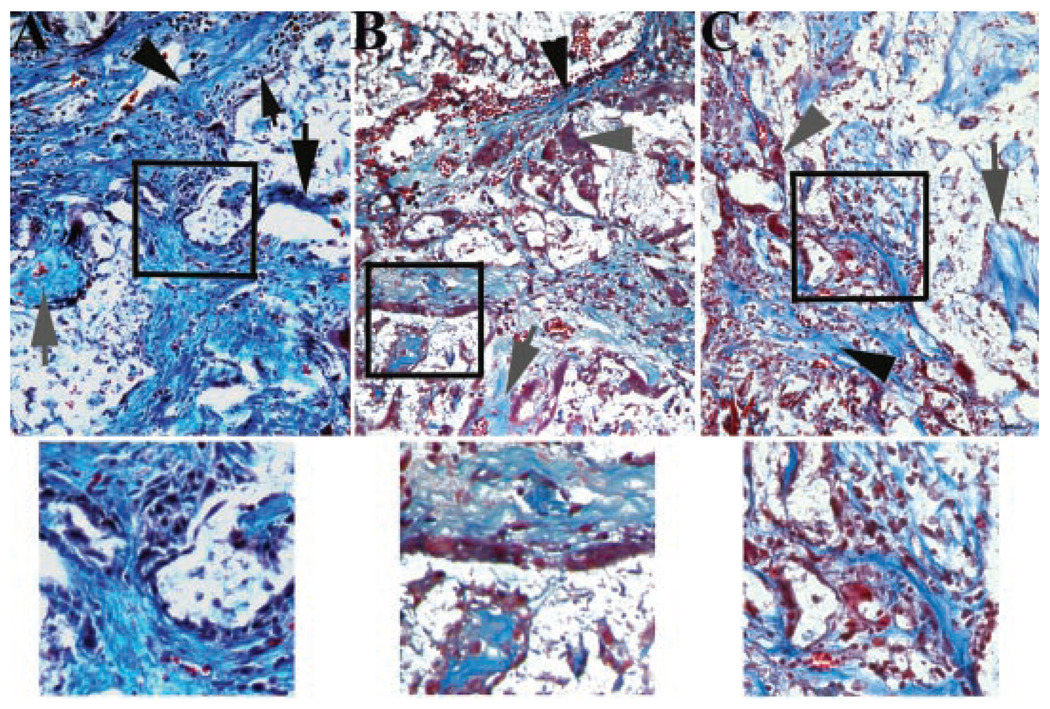
Figure 5.
Photomicrographs of the center of fusion masses (40×) from ASC treatment cohorts 4 weeks after implantation. Collagen fibers (black arrow head), scaffold remnants (large black arrow), woven bone (gray arrow), and amorphous matrix (gray arrow head) were evident in most images. Inflammatory infiltrate (small black arrow head) was significantly greater in the scaffold only treatment group (A) compared to the syngeneic (B) and allogeneic (C) ASC treatment groups that were not significantly different from one another. Higher magnifications of areas contained within black squares of each image illustrate the inflammatory infiltrate (A) and amorphous matrix (B and C) evident in the lower magnification images.

