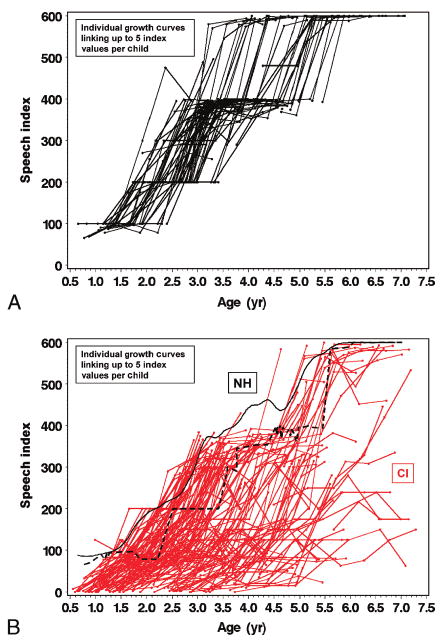
Fig. 3.

Growth trajectories between baseline and 24-month follow-up visit using SRI-Q index for (A) 97 NH children in black solid lines and (B) 188 CI children in red solid lines. The black solid curve (B) indicates the nonparametric mean trajectory of SRI-Q index by age for all 97 NH children. The black dashed line indicates the estimated lower boundary of SRI-Q score, by age, achieved by the NH children.
