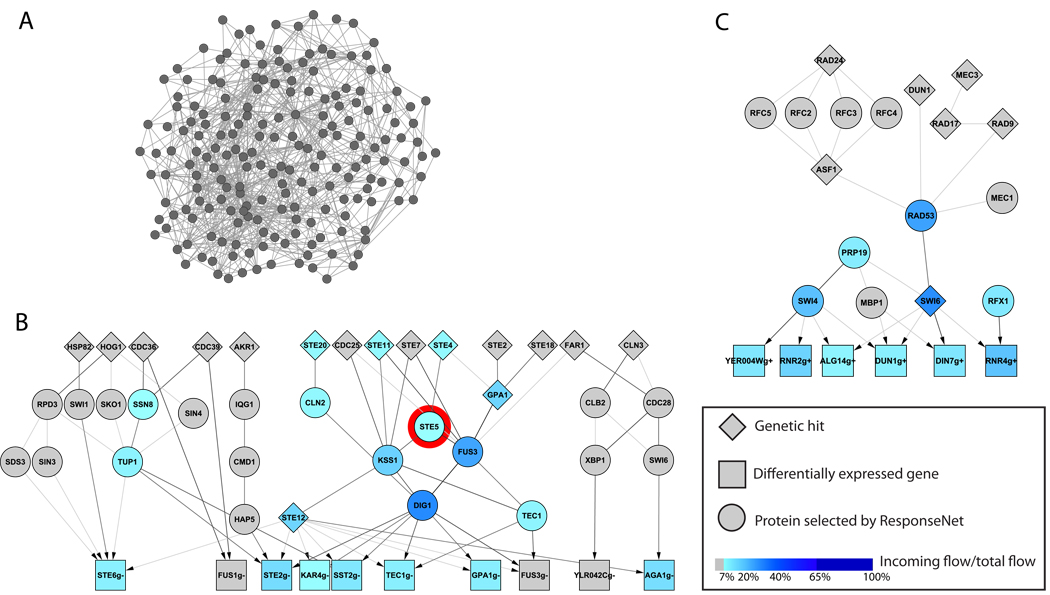
Figure 2. Interactome sub-networks connecting genetic and transcriptional data.
A. A network connecting genetic19 and transcriptional20 data of STE5 deletion strain via paths of length ≤ 3 edges finds 193 nodes and 778 edges.
B. The network created by ResponseNet connects the genetic19 and transcriptional20 data of STE5 deletion strain via 23 intermediary nodes and 96 edges. Higher ranked nodes, as determined by ResponseNet, appear in darker shades of blue and include core components of the pheromone response pathway. Ste5 itself, marked by a red circle, is ranked ninth among the top predicted proteins.
C. The highly-ranked part of the network created by ResponseNet upon connecting genetic hits4,21 to DNA damage signature genes22 identified in yeast treated with the DNA damaging agent MMS. The highest ranking intermediate nodes predicted by ResponseNet include core components of the DNA damage response pathway. The complete network appears in Supplementary Figure 7.
Each node represents either a protein or a gene, and edges represent protein-protein, metabolic, and protein-DNA interactions. The darkness of an edge increases with the amount of flow it carries. Differentially expressed genes are labeled with a suffix of g+ for up- and g- for down-regulation. Networks were visualized using Cytoscape.

