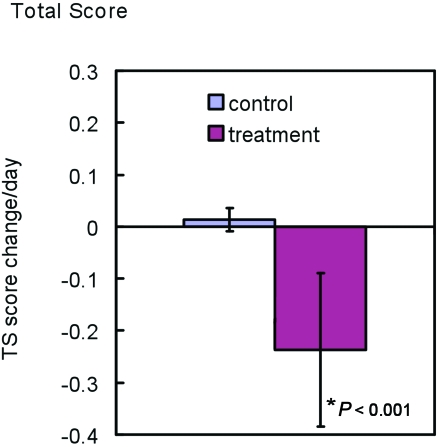
Figure 4.
Change in total score of endpoint assessment control (n = 16) and experimental (n = 20) groups as averaged daily. Data were calculated as numerical score change from initial day of study to endpoint divided by the total number of days each mouse participated in the study before euthanasia. Error bars, 2 SD.

