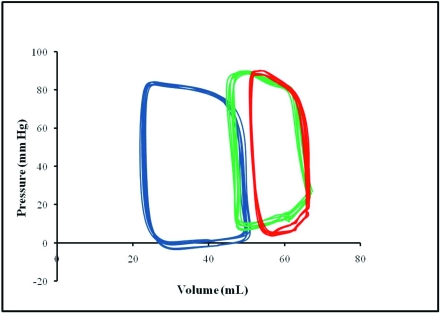
Figure 2.
Representative steady-state pressure–volume loops from 1 pig each at baseline (blue) and 1 wk (green) and 6 wk (red) after MI. Pressure–volume loops were constructed by plotting instantaneous pressure versus volume. The loop repeated with each cardiac cycle and showed how the heart transitioned from its end-diastolic state to the end-systolic state. After infarction, the pressure–volume loops narrowed, indicating reduction in stroke work, and shifted rightward due to increasing volume.

