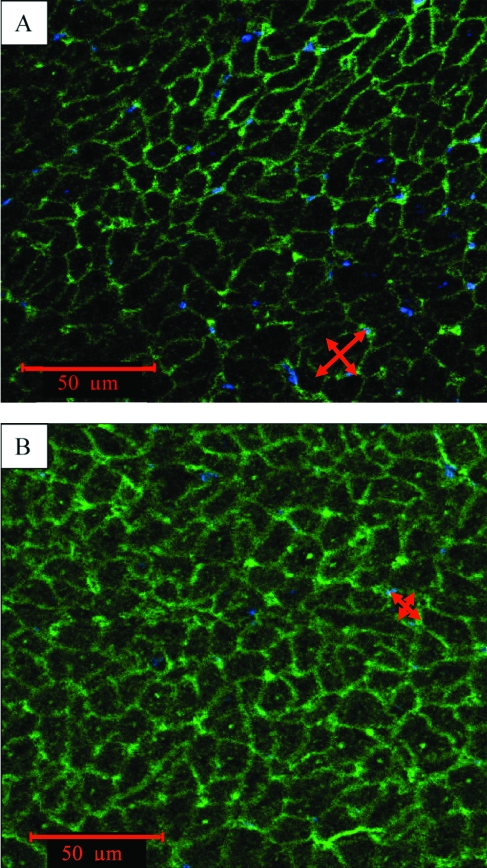
Figure 5.
Representative immunohistochemistry of (A) infarcted border zone and (B) noninfarcted area reveals increased myocyte cross-sectional area, associated with compensatory hypertrophy, in the infarcted border zone. Red arrows indicate sites where the cross-sectional measurements were taken. Scale bar, 50 µm.

