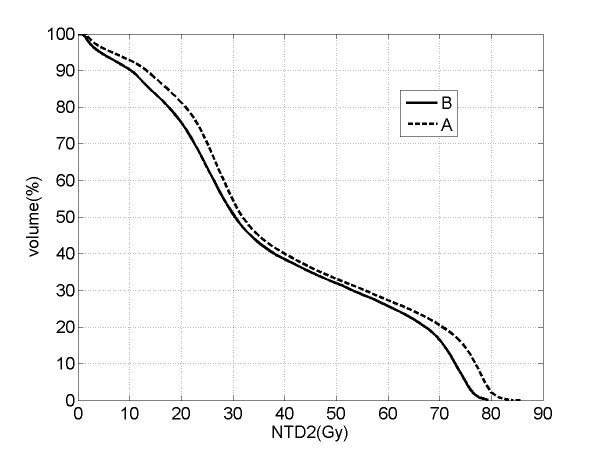
Figure 2.
The averages of the distributions of the normalized cumulative rectal wall dose-volume-histograms for arm A (dashed line) and for arm B (solid line). NTD2 on the X-axis indicates the biologically equivalent total dose normalized to the standard fraction of 2 Gy, supposing an α/β ratio of 3 Gy.

