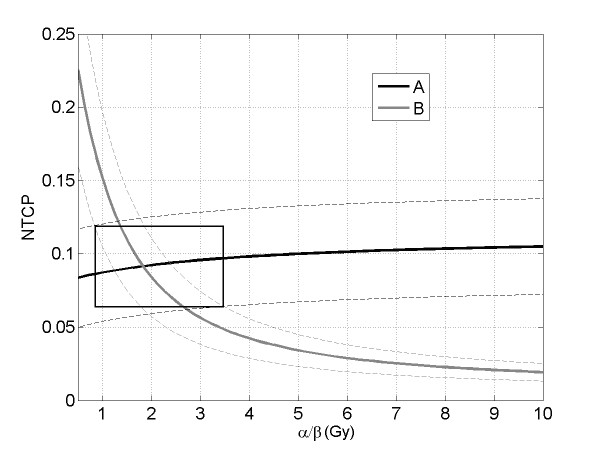
Figure 4.
Plot of the average Normal Tissue Complication Probability (NTCP) with its standard deviation (dashed lines) versus the α/β parameter, for the arm A (black line) and B (gray line). The other parameters were n = 0.12, m = 0.15 and TD50 = 80 Gy. The width of the box indicates the range of probable α/β values.

