
Figure 3.
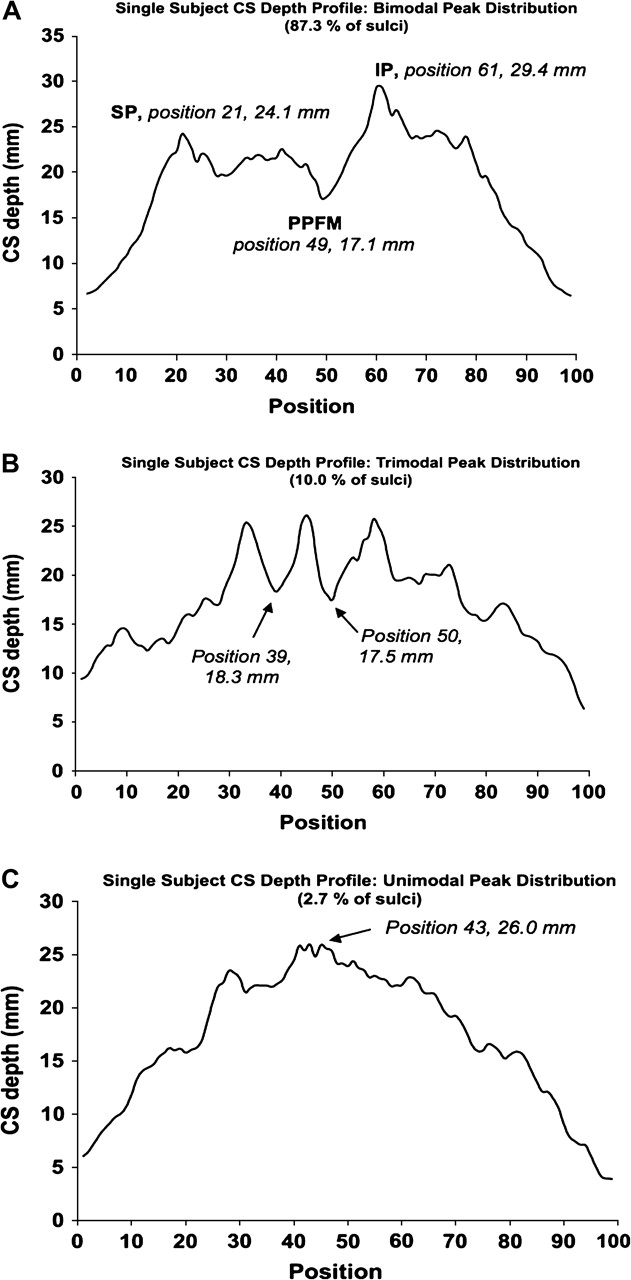
Patterns seen in individual sulcal depth profiles. Sulcal depth profiles of single sulci are shown that are representative of bimodal (A), trimodal (B), and unimodal (C) peak distributions. On the profile of a sulcus with a bimodal peak distribution, the superior peak (SP), PPFM, and inferior peak (IP) are labeled. A simple search algorithm determined the landmarks' position and depth (see Results for detail). The trimodal profile exemplifies a sulcus for which no PPFM was identified (2 shallow points of nearly equal depth between 3 surrounding peaks). The unimodal profile (C) was seen in only a few subjects. As our algorithm searched the 2 halves of the depth profile for distinct depth peaks, these cases were recognized as a single peak at the middle of the profile with no clear SP, IP, or PPFM.