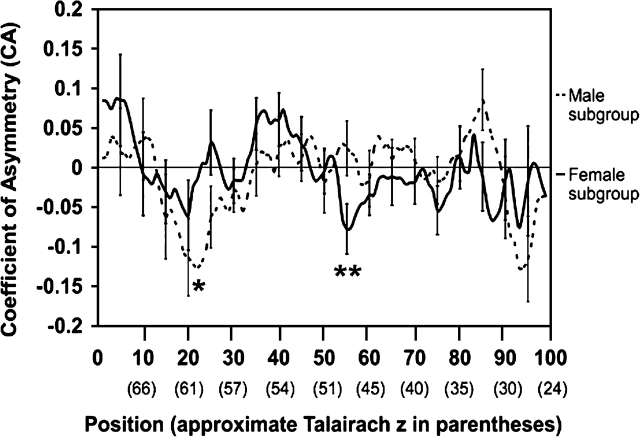
Figure 5.
Significant findings in the CA for the male and female subgroups. CAs are plotted by position (with the approximate Talairach z-coordinate in parentheses below) as in Figure 2. Only points that were significant after correcting for multiple comparisons are noted. Significant leftward asymmetry was seen in the CA profiles at positions 18–22 (approximate Talairach z = 60–63 mm) in the group profile (not shown), positions 19–24 (approximate Talairach z = 59–62 mm) in the male subgroup (single asterisk), and positions 54–57 (approximate Talairach z = 48–50 mm) in the female subgroup (double asterisks). As noted in Figure 2, Talairach z-coordinates displayed are the mean the z-coordinate at the sulcal fundus for any particular position in the group (n = 55). CAs were determined as described in the methods (e.g., negative CA = leftward depth asymmetry).

