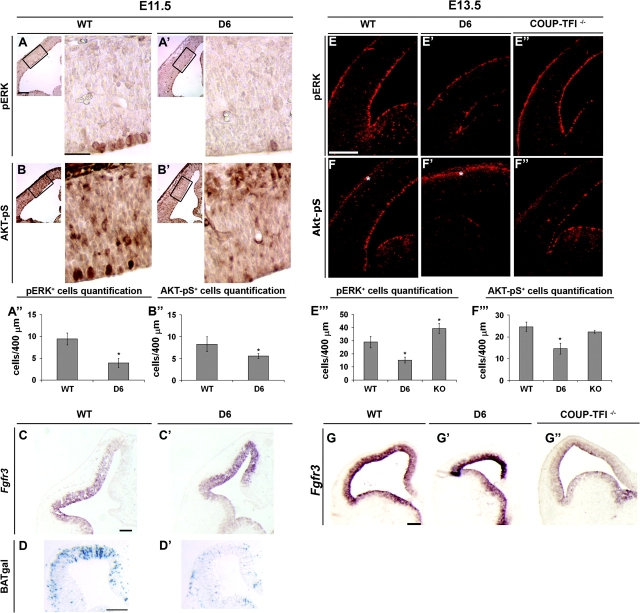
Figure 7.
Regulation of RTKs and β-catenin signaling. (A–B′) Immunohistochemistry on coronal sections at E11.5 for pErk (A–A′) and Akt-pS (B–B′), showing the early response of RTK signaling to COUP-TFI overexpression. The boxes show the area used for the high magnification picture on the right. This is the area where COUP-TFI is highly overexpressed (See Fig. 1A–A′). (A′′–B′′) Quantification of pErk+ (A′′) and Akt-pS+ (B′′) cells in A–B′. Asterisk in A′′: P < 0.00005; asterisk in B′′: P < 0.005. (C–C′) RNA in situ hybridization on coronal sections at E11.5 for Fgfr3, showing its upregulation. (D–D′) β-Galactosidase staining on coronal sections at E11.5 for β-catenin activation of the BAT-gal transgene. In D6/COUP-TFI (D6) brains β-catenin activation is reduced. (E–F′′) Immunofluorescence on coronal sections at E13.5 for pErk (E–E′′) and Akt-pS (F–F′′) in WT (E, F), D6/COUP-TFI (E′, F′), and COUP-TFI–/– (E′′, F′′), showing the complementary effects on these 2 signaling pathways by changing COUP-TFI dose. (E′′′–F′′′) Quantification of pErk+ (E′′′) and Akt-pS+ (F′′′) cells in E–F′′. Asterisks in E′′′: P < 0.0005 for D6 and KO; asterisk in F′′′: P < 0.007. (G–G′′) RNA in situ hybridization on coronal sections through the telencephalon at E13.5 for Fgfr3, showing its complementary regulation in D6/COUP-TFI (G′) and COUP-TFI–/– (G′′). Scale bars: 200 μm.

