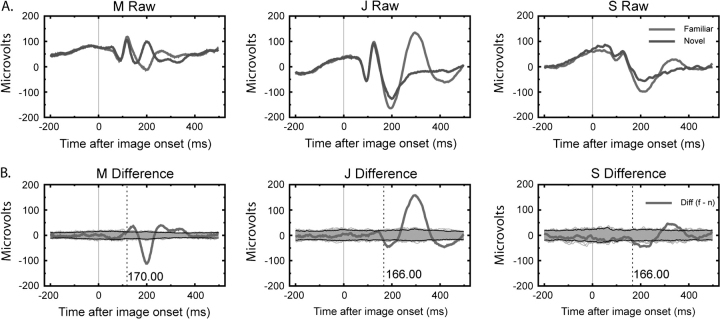
Figure 3.
Average LFP evoked by familiar and novel stimuli. (A) For each of 3 monkeys we show the visually evoked LFP to familiar and novel images averaged over all sessions for that monkey. Although the magnitude of the response varies, the general morphology is the same and there is a consistent increase in the magnitude of the LFP to familiar stimuli after 150 ms. (B) Permutation tests are used to confirm the statistical significance of the differences. For each monkey we recalculated the familiar–novel difference after scrambling the labels “familiar” and “novel”. The gray zone shows the range of the result over 1000 permutations and areas where the empirical difference (bold red line) exceeds the permutation sample are highlighted (dashed vertical lines). Black lines denote the 99% confidence interval bounds.

