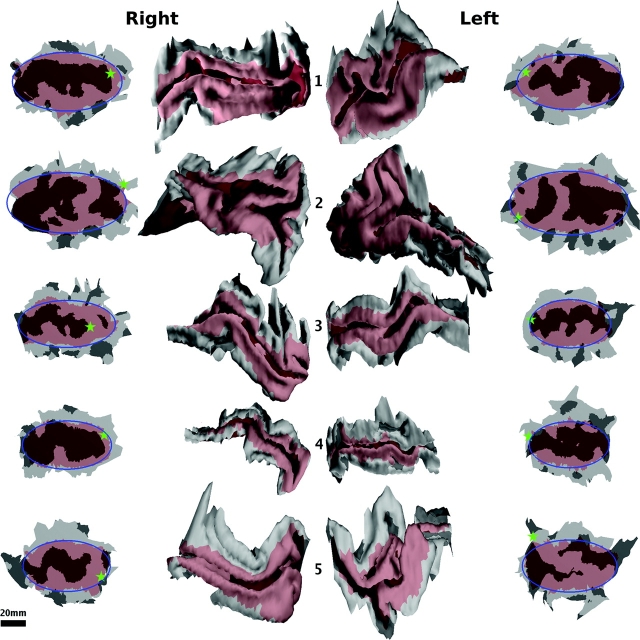
Figure 2.
The surfaces reconstructed from MRI data of all samples. The surface of the stria of Gennari is shown in red. The sign of the mean curvature of the cortical surface is indicated by light and dark shading. V1 of the 5 right hemispheres are shown in the second column with posterior to the right and dorsal to the top. The 5 left hemispheres are shown in the third column with posterior to the left and dorsal to the top. Overall, the shape, location, and size of V1 shows substantial variation. The first and fourth columns show flattened 2-dimensional configurations of the V1 surfaces shown in the second and third columns, respectively. The boundary of flattened V1 exhibits a consistent shape, whereas the 3-dimensional shape exhibits more variability. The best-fitting ellipse to the boundary of V1 is superimposed in blue. The location of the occipital pole is indicated by a green star. The scale bar applies to the flattened surfaces only as the 3-dimensional surfaces have been enlarged to show detail but are to scale with one another.

