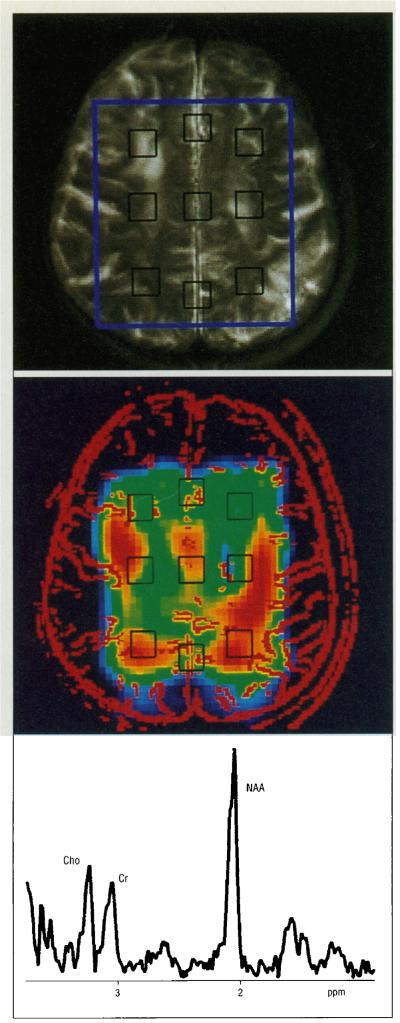
Figure 1.
A, Transaxial T2-weighted magnetic resonance imaging (MRI) of a subject with subcortical ischemic vascular dementia showing the 1H magnetic resonance spectroscopic imaging (MRSI) field of view (red), the PRESS volume (blue), and the position of the nine voxels (black). B, 1H MRSI from the same subject, with high-pass filter of the MRI in red and of the nine voxels in black. C, Proton spectrum from the white matter of a subject with Alzheimer’s disease. Cho indicates choline-containing metabolites; Cr, creatine plus phosphocreatine; and NAA, N -acetylaspartate.

