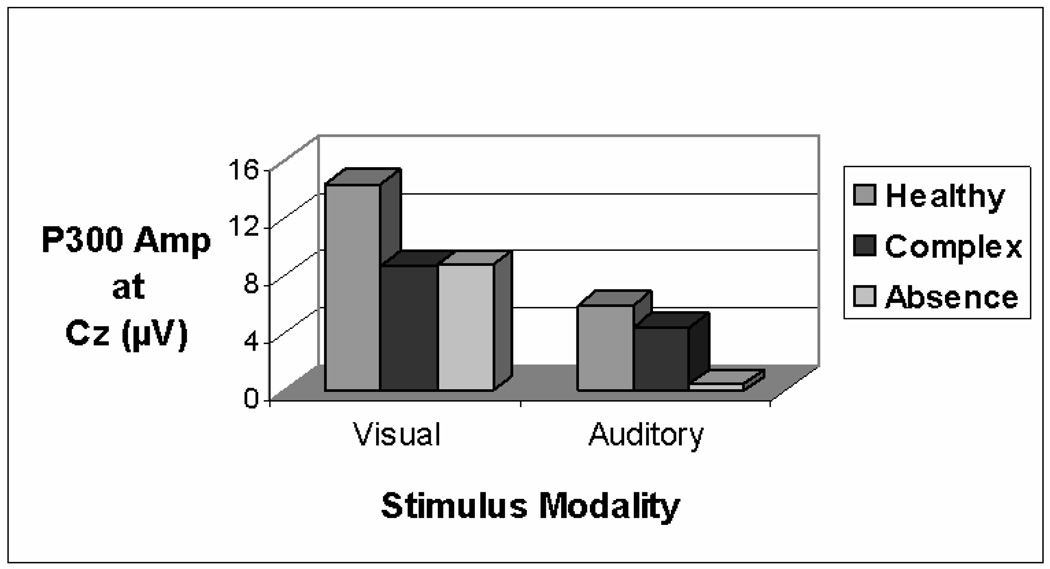
Fig 3.
P300 amplitude at Cz in the Visual and Auditory CPT. It is apparent that as compared with the healthy control group, the two seizure groups had smaller P300s in the visual CPT. However, in the Auditory CPT, only the absence patients had a significantly smaller P300 in comparison to the seizure and healthy controls.

