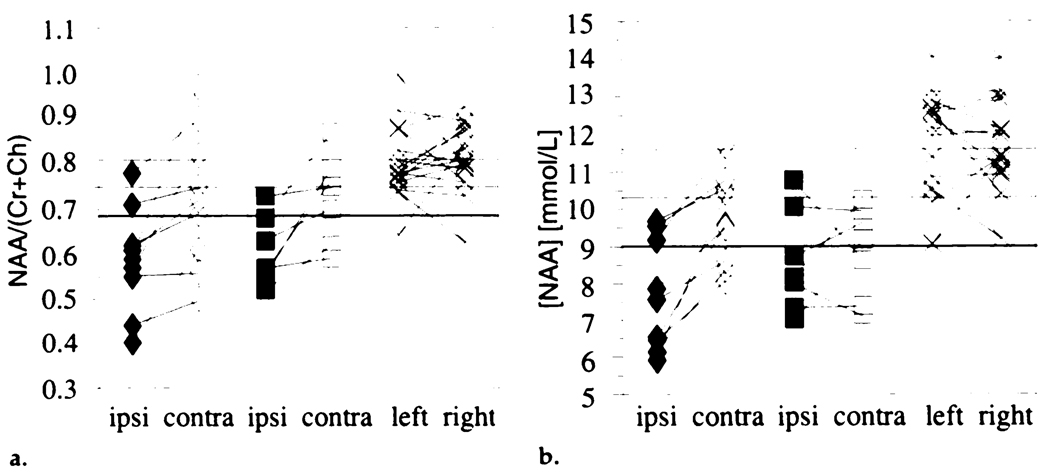
Figure 2.
(a) Individual N-acetylaspartate/(creatine + choline) ratios and (b) N-acetylasparate concentrations in the same side as the seizure focus in patients with (◆) and in patients without (■) hippocampal atrophy and in the opposite side in patients with (◇) and in patients without (□) hippocampal atrophy and in healthy control subjects (×). The control mean (top line) and mean – 1 (middle line) or 2 (lower bold line) standard deviations are indicated. Ch = choline, contra = opposite side, Cr = creatine, ipsi = same side, NAA = N-acetylaspartate.

