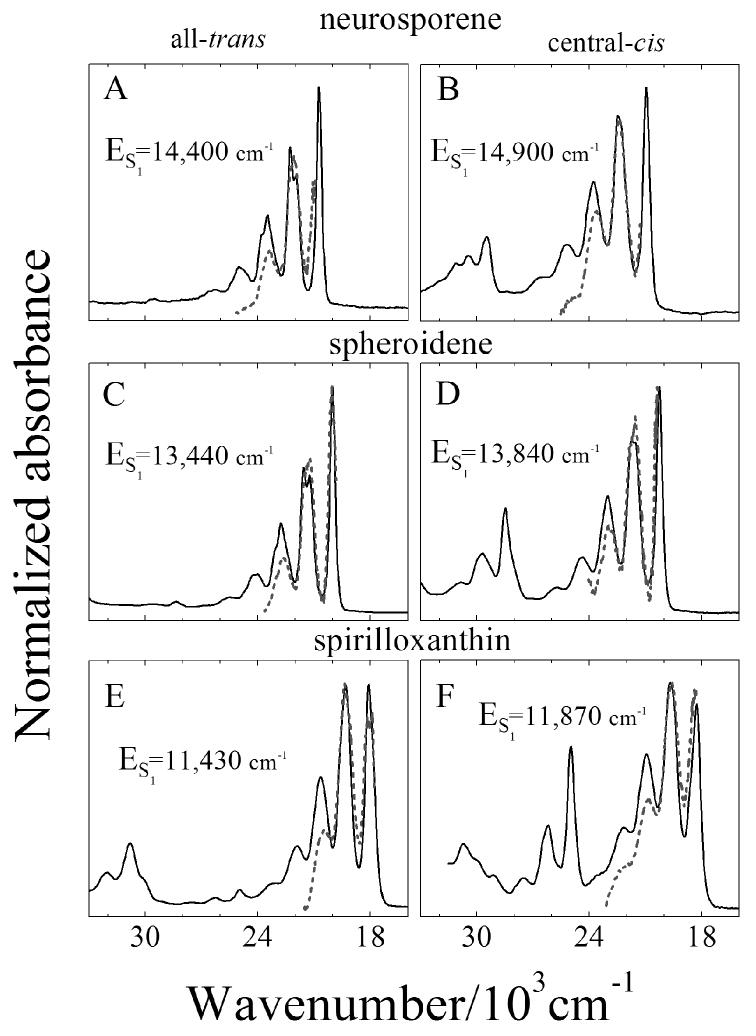
Fig. 6.

The S1 (21Ag-) → S2 (11Bu+) NIR transient absorption profiles (dashed lines) from Fig. 5 shifted in energy to give the best agreement with the steady-state absorption spectra (solid lines) from Fig. 2 plotted on a wavenumber scale. The magnitude of the shift of the S1 (21Ag-) → S2 (11Bu+) NIR spectra to bring the lineshapes into coincidence determines the energy of the S1 (21Ag-) state for each carotenoid isomer. These values are indicated in the figure and in Table 1.
