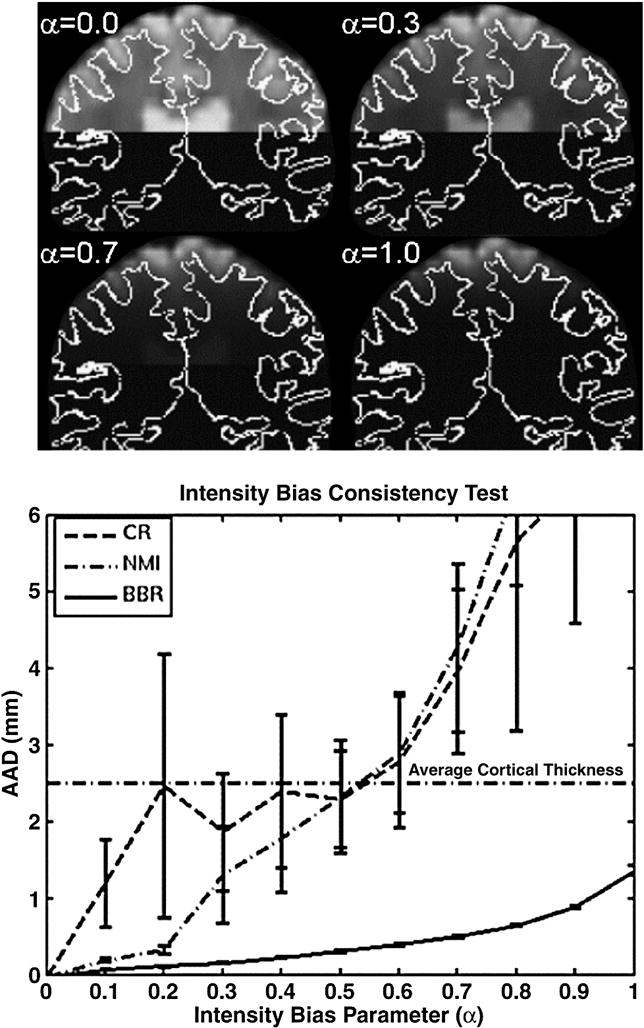
Figure 6.

The top panel shows a coronal slice of the functional for four values of α in order to demonstrate how the intensity of each slice was attenuated using a half-cosine intensity bias model. The white curve is the gray/white boundary. For α=0, there is no bias; α=1 gives the maximum bias. Bottom panel shows how each method performed as the bias parameter was changed. The confidence intervals represent 1 standard error.
